• 0 Posts
  • 29 Comments
Joined 1 year ago
cake
Cake day: June 14th, 2023

help-circle


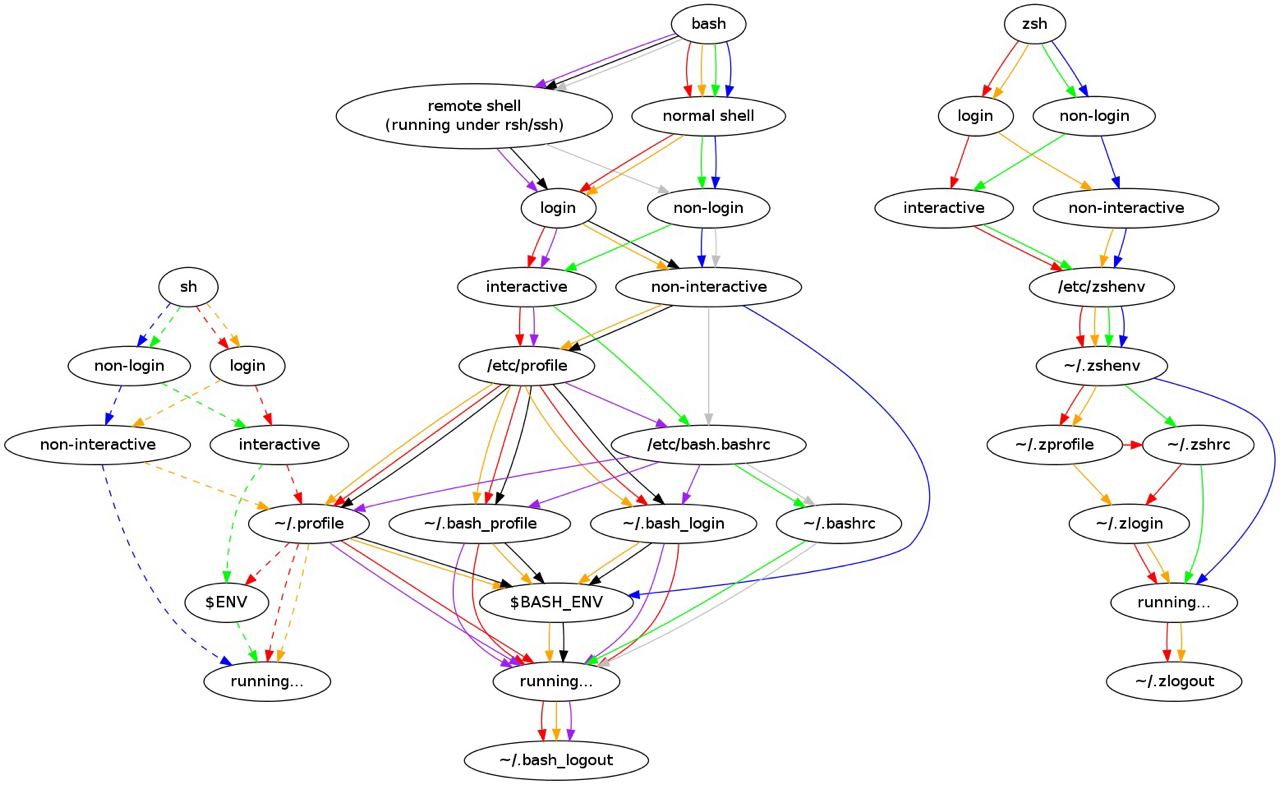
  • I found this diagram on SO at one point but I can’t find the post and it is the best explanation I have found for how all of the files work for bash and zsh, each color is an individual path of execution (eg, follow the red line).

    Bottom line though, it only really matters if you are overriding something that is already defined, for example I tell my users to use zshrc and I provide defaults and common things in zprofile because zshrc is executed last when they login.


  • I mean sure but that’s a lot of words to say “I didn’t read the directions and no one caught it in a merge request review because no one else read the directions either.”

    Their documentation and examples are pretty easy to read and the site parameter is explained in the getting started guide and even linked from the readme for the JavaScript sdk, and in lots of sample configurations so I’m not sure how this made it into a release and then no one noticed the missing metrics for eleven days, sounds like lots of issues in that shop.

    The behavior of the sdk isn’t great but the proposed solution wouldn’t work because you can use custom endpoints for all of the components using endpoints on domains you own anyway.


  • Yeah I’m with you, I read most of it but I just don’t know where the disdain comes from. At most scales of infrastructure anymore you can use them interchangeably because the difference is immaterial in practical applications.

    Like if I am going to provision 2TB I don’t really care if it’s 2000 or 2048GB, I’ll be resizing it when it gets to 1800 either way, and if I needed to actually store 2TB I would create a 3TB volume, storage is cheap and my time calculating the difference is not.

    Wait until you learn about how different fields use different precision levels of pi.


  • I think what this person is saying is that systems and services have been monitored for metrics and logs for a long time, I know I have been doing it for more than 20 years across many OS, hardware platform, and software stack. The tools and depth of the integrations have definitely changed and gotten way better and more sophisticated but I definitely made systems that monitored and healed themselves to varying levels of efficiency since at least using Nagios in 2003 (I’m getting Perl PTSD flashbacks now hah).

    One thing that has definitely gotten better in the last 5 or so years though is code level instrumentation and tracing as well as the higher level correlation tools. I have also seen more developers and vendors way more willing to implement monitoring features in their code from the beginning leading to more data and less duct tape and guessing which has been FANTASTIC.

    Anyway, great post though, the monitoring arena is definitely way more awesome than ever before these days that is for sure.


  • I have been using the app Raindrop for this function, the integration for obsidian is awesome. Raindrop also lets you highlight and tag your bookmarks and it saves those into obsidian as well. The share function through the iOS share sheet is really great too, you can categorize and add tags right then too, definitely recommend it in general. Site is raindrop.io

    I don’t think you need a subscription for most of it, maybe the highlights, I pay for one for the permanent library feature and so it will stick around so I can’t remember but they do have a free option.